Linear Regression
Introduction
Linear regression is a statistical method used to model the relationship between a dependent variable and one or more independent variables. It assumes a linear relationship between the independent variables and the dependent variable.
In simple linear regression, we model the relationship between one independent variable x and one dependent variable y as a straight line:
y=β0+β1x+ε
where:
- y is the dependent variable,
- x is the independent variable,
- β0 is the intercept,
- β1 is the slope,
- ε is the error term.
Here's a simple example to illustrate linear regression:
Let's consider a scenario where we predict the salary of an employee based on their years of experience. This is a classic example often used to illustrate simple linear regression.
1. Collect Data
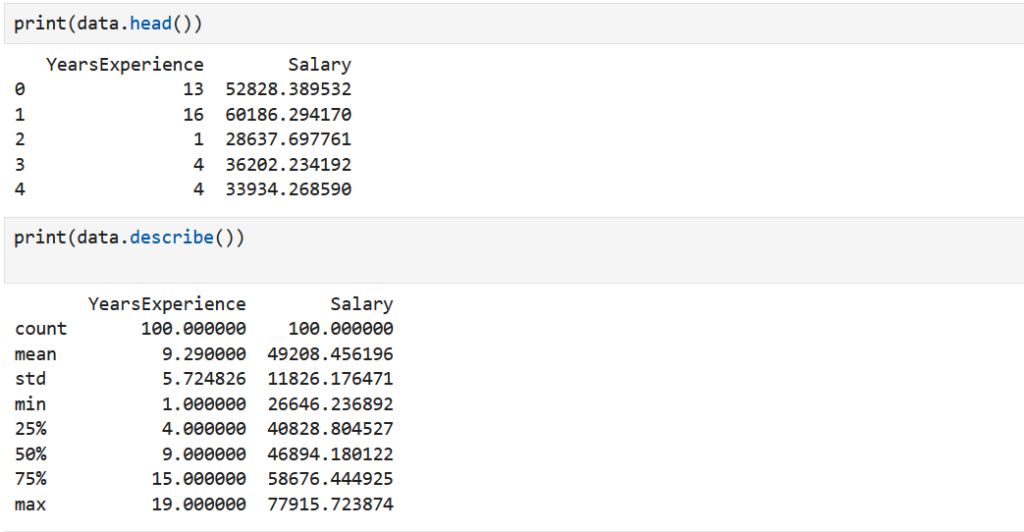
Suppose we have collected data on the years of experience and the corresponding salary of employees. For this example, let's create a synthetic dataset:
- We generate synthetic data for years of experience and salary.
- Years of experience range from 1 to 20 years.
- Salary is generated using a linear equation with some noise.
3. Prepare Data
We separate the independent variable (years of experience) and the dependent variable (salary):
4. Split Data
We split the data into training and testing sets:
5. Create and Fit Model
We create a linear regression model and fit it to the training data:
6. Make Predictions
We use the fitted model to make predictions on the test data:
7. Evaluate Model
We evaluate the model's performance using metrics such as mean squared error (MSE) and R-squared:
8. Visualize Result
We visualize the relationship between years of experience and salary, along with the regression line:


