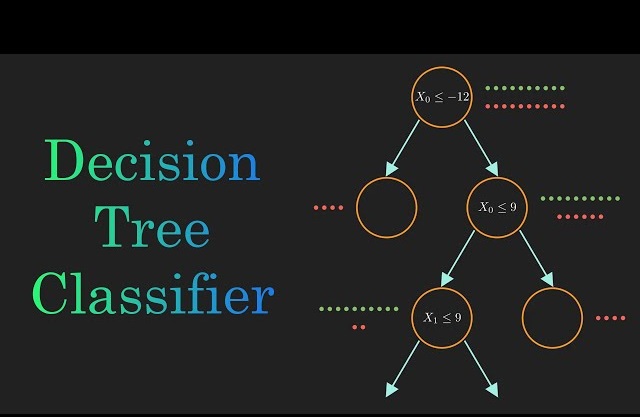
Decision Tree Classifier
Introduction
Decision Tree Classifier is a popular machine learning algorithm used for both classification and regression tasks. It creates a tree-like structure where each internal node represents a feature or attribute, each branch represents a decision based on that feature, and each leaf node represents a class label (in classification) or a target value (in regression).
Here's how Decision Tree Classifier works:
- Splitting Criteria
- The algorithm selects the best feature to split the data at each node based on a certain criterion, such as Gini impurity, entropy, or information gain.
- Gini impurity measures the probability of incorrectly classifying a randomly chosen element if it were randomly labeled according to the distribution of labels in the node.
- Entropy measures the uncertainty or disorder of a set of labels.
- Building the Tree
- The tree is recursively built by splitting the data into subsets based on the selected feature.
- This process continues until one of the stopping criteria is met, such as reaching a maximum tree depth, minimum number of samples per leaf node, or no further improvement in impurity reduction.
- Pruning
- After the tree is built, it may be pruned to prevent overfitting.
- Pruning techniques include post-pruning (removing nodes from the tree after it's built) and pre-pruning (stopping the tree-building process early).
- Classification
- To classify a new data point, it traverses the tree from the root node to a leaf node, following the decision rules at each node based on the feature values of the data point.
- The class label assigned to the leaf node is the predicted class label for the data point.
- Handling Categorical and numerical Features
- Decision trees can handle both categorical and numerical features
- For categorical features, the tree considers each category separately during the splitting process.
- For numerical features, the tree selects a threshold to split the data into two subsets.
- Interpretability
Decision trees are highly interpretable, as the rules for classification are easily visualized in the form of a tree structure
- Ensemble Methods
Decision trees can be combined into ensemble methods such as Random Forest and Gradient Boosting to improve performance and reduce overfitting
Decision Tree Classifier is versatile, easy to understand, and capable of capturing complex relationships in the data. However, it's prone to overfitting, especially when the tree depth is not properly controlled. Regularization techniques like pruning and using ensemble methods can help mitigate this issue.
Let's consider an example of using the Decision Tree Classifier for a binary classification task using the famous Iris dataset:
- We import the necessary libraries and modules from scikit-learn.
import numpy as np
import pandas as pd
from sklearn.datasets import load_iris
from sklearn.model_selection import train_test_split
from sklearn.tree import DecisionTreeClassifier
from sklearn.metrics import accuracy_score, classification_report, confusion_matrix
from sklearn.tree import plot_tree
import matplotlib.pyplot as plt
- We load the Iris dataset using the load_iris function from scikit-learn.
iris = load_iris()
X = iris.data
y = iris.target
- We split the data into training and testing sets using the train_test_split
X_train, X_test, y_train, y_test = train_test_split(X, y, test_size=0.2, random_state=42)
- We create an instance of the DecisionTreeClassifier
model = DecisionTreeClassifier()
- We fit the classifier to the training data using the fit
model.fit(X_train, y_train)
- We make predictions on the test data using the predict
y_pred = model.predict(X_test)
- We evaluate the model's performance using metrics such as accuracy, confusion matrix, and classification report.
accuracy = accuracy_score(y_test, y_pred)
conf_matrix = confusion_matrix(y_test, y_pred)
class_report = classification_report(y_test, y_pred)
print("Accuracy:", accuracy)
print("Confusion Matrix:\n", conf_matrix)
print("Classification Report:\n", class_report)
- We visualize the decision tree using the plot_tree function from scikit-learn, which provides a graphical representation of the decision rules learned by the classifier.
plt.figure(figsize=(12, 8))
plot_tree(model, filled=True, feature_names=iris.feature_names, class_names=iris.target_names)
plt.show()
This example demonstrates how to use the Decision Tree Classifier for a binary classification task using the Iris dataset. The decision tree learns to classify iris flowers into three species (setosa, versicolor, virginica) based on features such as sepal length, sepal width, petal length, and petal width. The decision tree visualizes the decision rules used for classification, making it easy to interpret how the model makes predictions.

