K Means Clustering
Introduction
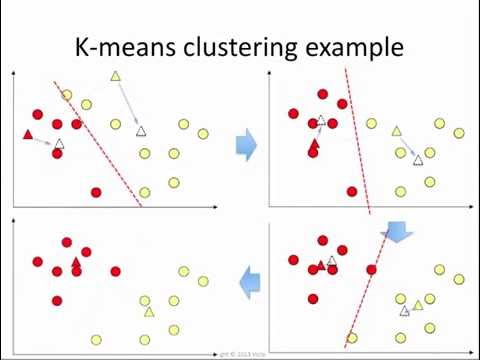
K-means clustering is a popular unsupervised learning algorithm used for clustering similar data points together into a predefined number of clusters. It aims to partition the data into k clusters where each data point belongs to the cluster with the nearest mean, or centroid. K-means clustering is an iterative algorithm that converges to a solution by minimizing the within-cluster variance.
Here's how K-means clustering works:
- Initialization
- Choose the number of clusters, k, that you want to create.
- Randomly initialize k cluster centroids (points in the feature space) as the initial positions for the clusters.
- Assignment Step
- For each data point in the dataset, calculate the distance to each cluster centroid.
- Assign the data point to the cluster whose centroid is closest to it. This is typically done using a distance metric such as Euclidean distance.
- Update Step
- After all data points have been assigned to clusters, compute the new centroids of the clusters.
- The new centroid of each cluster is the mean of all the data points assigned to that cluster.
- Convergence
- Repeat the assignment and update steps iteratively until convergence criteria are met.
- Convergence criteria can include a maximum number of iterations, no change in cluster assignments, or a small change in centroids between iterations.
- Output
Once the algorithm converges, the final cluster centroids represent the centers of the clusters, and each data point is assigned to a specific cluster.
- Evaluation
- K-means clustering does not have an intrinsic evaluation metric since it is an unsupervised learning algorithm.
- However, the quality of the clustering can be assessed using metrics such as the within-cluster sum of squares (WCSS) or silhouette score.
K-means clustering is widely used for various applications such as customer segmentation, image compression, document clustering, and anomaly detection. However, it has some limitations, such as sensitivity to the initial cluster centroids, dependence on the number of clusters chosen (k), and the assumption of isotropic clusters with equal variance. To mitigate these issues, techniques like K-means++ initialization, choosing an appropriate value of k, and using other clustering algorithms like hierarchical clustering or DBSCAN can be considered.
Let's go through an example of using K-means clustering to cluster a synthetic dataset into two clusters:
- We import the necessary libraries and modules, including NumPy for numerical operations, Matplotlib for visualization, and scikit-learn for generating synthetic data and performing K-means clustering.
import numpy as np
import matplotlib.pyplot as plt
from sklearn.datasets import make_blobs
from sklearn.cluster import KMeans
- We generate synthetic data using the make_blobs function from scikit-learn. We create 300 data points with 2 clusters, each with a standard deviation of 0.6.
X, _ = make_blobs(n_samples=300, centers=2, cluster_std=0.6, random_state=42)
- We visualize the synthetic data using a scatter plot, where each data point represents a sample with two features.
plt.figure(figsize=(8, 6))
plt.scatter(X[:, 0], X[:, 1], s=50, cmap='viridis')
plt.title('Synthetic Data')
plt.xlabel('Feature 1')
plt.ylabel('Feature 2')
plt.show()
- We perform K-means clustering using the KMeans class from scikit-learn. We specify the number of clusters (n_clusters=2) and set the random_state for reproducibility.
kmeans = KMeans(n_clusters=2, random_state=42)
- We fit the K-means model to the data using the fit
kmeans.fit(X)
- We extract the cluster centroids and cluster labels from the trained K-means model.
centroids = kmeans.cluster_centers_
labels = kmeans.labels_
- We visualize the clusters and centroids using a scatter plot. Each data point is colored according to its assigned cluster label, and the centroids are indicated by red stars.
plt.figure(figsize=(8, 6))
plt.scatter(X[:, 0], X[:, 1], c=labels, s=50, cmap='viridis', alpha=0.5)
plt.scatter(centroids[:, 0], centroids[:, 1], marker='*', s=200, c='red', label='Centroids')
plt.title('K-means Clustering')
plt.xlabel('Feature 1')
plt.ylabel('Feature 2')
plt.legend()
plt.show()
This example demonstrates how to use K-means clustering to cluster a synthetic dataset into two clusters. K-means successfully identifies the two clusters in the data and computes the centroids as the centers of each cluster. The visualization helps us understand how the data points are grouped into clusters based on their similarity.

